|

Symphony
Home Page | Tutorial
| Use Symphony Now!
TUTORIAL

Symphony
v.3 Guide
Symphony is a collection of several
computer tools that allow you to gather and analyze data in order to investigate a
scientific question. With this version of Symphony, you can gather data that has been
collected by others and which is accessible via the Internet. This data gathering
component of Symphony is called the DataWarehouse. You will be able to visualize
the data that you gather by graphing it for analysis. We call the visualization component
Viz-It.
You will also be able to build models to try to understand how different systems work. The
modeling component is called Model Builder (beta).
To start your investigation and to help you understand how to use
Symphony, we will first guide you through the different tools in Symphony, using a sample
question to start the investigating. After you see the different tools in Symphony, you
will then begin investigating questions of your own.
Investigating a Problem
Now that you are logged in, let’s start
investigating a sample question. To get started, consider the following driving question:
Are
carbon monoxide levels worse in an urban area or an area with less population density?
How might you go about investigating this question? Here is a
brief overview of the different activities you might do to investigate the question:
• Develop the problem.
• Gather the data you need for this problem.
• Visualize the data by building graphs of the data.
• Analyze the graphs in order to interpret what the graphs are
"saying".
• Build models to try and better understand a system and data
about that system.
• Review your progress and results by revisiting your driving
question to see if you have an answer, or if further investigation is needed.
• Review the problem to write down new questions that arise.
Given this overview of activities for your investigation, let’s
see how you can use Symphony to perform these different activities.
Symphony Tour
Let’s start by looking at the Symphony main
screen (figure 1). The main screen is divided into two areas:
• The plan/log area is where you can plan and keep track
of the activities you will perform in your investigation. Here, you see the main process
map, the Conductor, and your Plan/Log grid, which you will soon use to conduct an
investigation.
• The activity area is blue area where you will actually
perform investigative activities. You will soon see the different activity workspaces that
open here for you to perform your different activities.
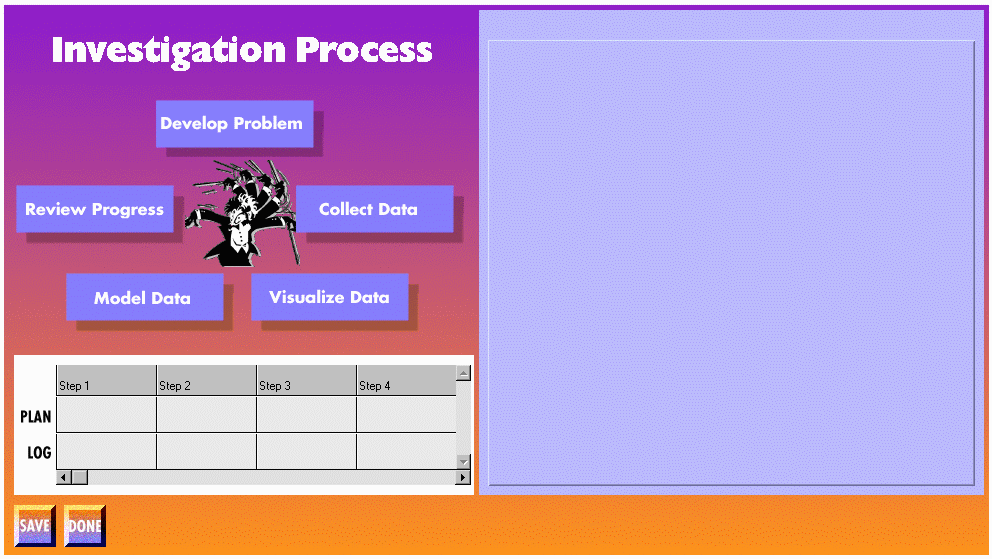
Figure 1: Symphony main screen
Aside from the main screen, you can also bring up the
Conductor
window (figure 2). The Conductor window can give you hints about some of the big
things that you can do next as you use Symphony. You can open the Conductor window by
clicking on the conductor (we like to call him Watson) in the center of the main process
map. Try it now.
Since you will be starting a new investigation, there is only one
option in the Conductor window: Start my plan. Press this button and you will see a
couple of things. First, you will notice some text in the Conductor window. The text will
give you a brief description about the item in the button that you just pushed. Here, you
will see some information about starting your plan.
Second, you will notice that the process map changed colors when you
pressed the button in the Conductor window. Some of the Conductor options will color the
map to give you some extra information. The colors on the map mean the following:
• A dark blue activity is the last activity that you performed
and saved.
• Blue activities are recommended next steps.
• Light blue activities are activities are possible next steps
(but may not be the most logical next steps.)
You can bring up the Conductor at different points of this tour so
you can see some of your different options.
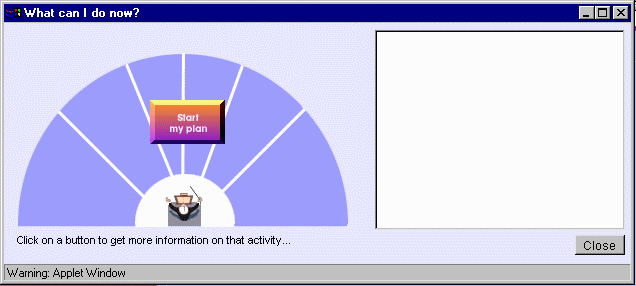
Figure 2: Conductor window
Finally, there is one more item to note here:
rollover help.
If you move the mouse pointer over the different activities in the main process map, you
will see a description of the selected activity pop up. Try this with the different
process maps that you will see as we proceed with the Symphony tour.
Developing the Problem
We will start by developing the problem.
Developing the problem involves describing your driving question. It also involves
deciding on the factors involved in your question, describing your hypothesis, composing a
general plan for your investigation, and recording research notes.
To set up an activity, you drag an activity button from a process
"bubble" on the main process map into the Plan row of the Plan/Log grid.
Let’s begin by setting up a Develop Problem activity in Step 1:
• Click and hold in the
Develop Problem bubble until you
see a Develop Problem button appear.
• Drag the Develop Problem button down and drop it into
the Step 1 cell of the Plan row.
That’s it, you have now set up the first activity in your
investigation. Notice that you now have a Develop Problem button in the Plan row.
Pressing that button opens up a workspace in the activity area of the main screen where
you can start developing the problem (figure 3).
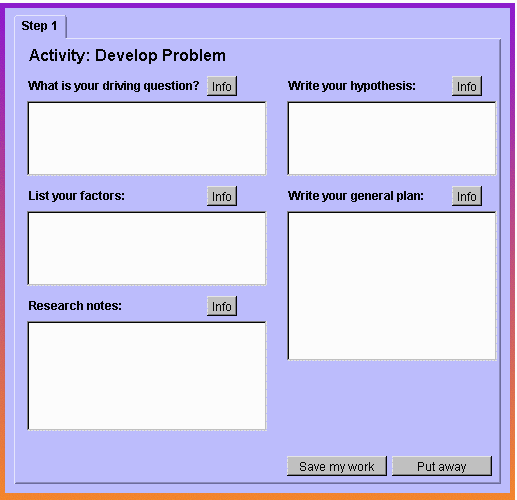
Figure 3: Develop Problem Workspace
Now that this workspace is open, do the following:
• Answer the different questions as thoroughly as you can. If
you need information on any of the items in the workspace, click on an Info button.
• When you have entered some information, click Save my work to
save the work you did in the workspace. It is very important that you save your
workspace anytime you make any changes, otherwise you will lose access to that work.
Also,
when you save a workspace, please save the plan/log grid by clicking the Save button
under
the plan/log grid. You will get a confirmation window stating that you have saved your
Symphony session. (If you do not get a confirmation window, please click on the Save
button under the plan/log grid again.)
Notice now that the plan button for
Develop Problem has moved
down from the Plan row to the Log row. This means that you have worked on and saved the
activity that was in the Plan row. Press the Put away button in the Develop Problem
workspace to close it. If you now click on the dark button in the Log row, you’ll see
that the Develop Problem workspace that you worked on and saved opens up.
Throughout your investigation, you can open workspaces you’ve saved from your Log row
to review or make additions to your previous work.
Now that you’ve worked on developing your problem, let’s
move on to collecting data.
Collecting Data
How will we go about collecting data? In this
version of Symphony, we will search the DataWarehouse for data that pertains to the
driving question. Recall the DataWarehouse contains data collected by others that you can
access over the Internet.
To set up a Collect Data activity, you go through the same
steps as you did to set up the previous activity. Click and hold in the Collect Data
bubble of the process map until the Collect Data button appears and then drag it
down to the Step 2 cell. Press the button you just added to the Plan row to open your data
collection workspace (see figure 4).
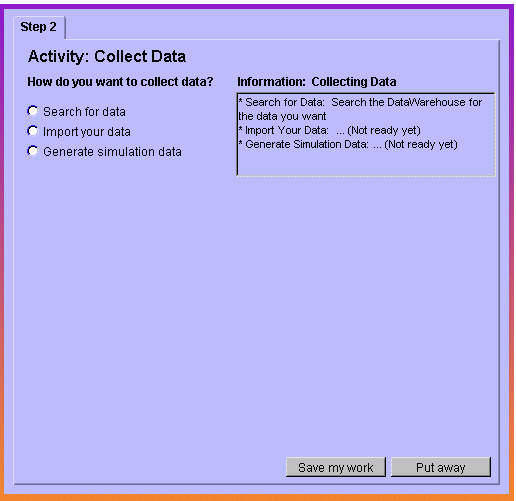
Figure 4: Data Collection Workspace
Note that the data collection workspace is a bit different that
the previous workspace you saw. The workspace opens up with a couple of items. First, you
see a series of buttons that describe the different ways you could collect data. The text
box next to these buttons gives a brief description of each data collection option.
Currently, you can only search for data, but we want you to start seeing that there are
different ways scientists can go about collecting data (marked by the other two choices).
To start working on data collection, click on the Search for data
button. The workspace now shows some new items (figure 5):
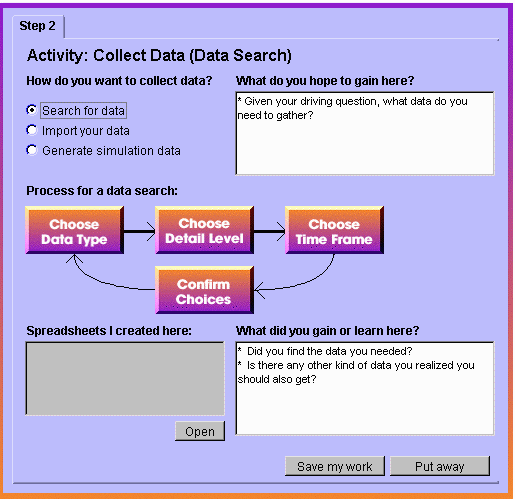
Figure 5: Expanded Data Collection Workspace
The text box to the right of the buttons has changed to an area
where you can reflect on and record your goals for this activity: why are you collecting
data, what do you hope to gain, etc. The text box will contain prompts that describe some
things you should think about here. Throughout Symphony, you will see these prompts to
help you reflect on and focus on the work you should be doing in the different
investigative activities.
So now, in the text box, explain your data collection goals. Recall
the carbon monoxide driving question: What kind of data do you think you need to collect?
Justify the type of data you hope to later obtain.
Next, notice the data search process map. This process map shows the
steps needed to collect data from the DataWarehouse. You will search the DataWarehouse and
the data that you find will be placed into a spreadsheet. Let’s start going through
the data search process map:
• Click on the Choose Data Type button. The window that opens
has tabs for the different types of data in the Warehouse. What kind of data do you want
to look for? Given the driving question, let’s get some carbon monoxide data for a
less dense area (say, Kalamazoo).
Let’s take a look at the Michigan map. To select the city whose
data you want, simply click on the name of the city (whose name will then appear in the
box next to the map). Sometimes, in order to see the appropriate city, you might need to
zoom in the map. You select the square area to zoom into by clicking and holding the left
mouse button, dragging the mouse to make a box and releasing the mouse button. To zoom
out, simply click on the map using the right mouse button. To move around the map
(especially when you’ve zoomed in), click on the Navigator button. You will see a
small map with a red box. Moving the red box changes your view on the map.
• Click Choose Detail Level. At what frequency do you want to
collect data? Let’s collect monthly average carbon monoxide data.
Select month from the first menu and
average from the
second menu (you might want to click on the menu just to see what the different options
are. Click OK.
• Next, click on Choose Time Frame. Here you set the start and
end date defining your search. For what time interval do you want to find data? Let’s
select a pretty long interval.
Select January 1, 1992 as the start date and January 1, 1994 as the
end date. Click OK.
• Click Confirm Choices. This lets you review the choices you
have made to make sure the specifications for your data search are correct.
Notice that really long name in the Confirm window? That’s the
name of the spreadsheet row where the data you find will be placed. The name is long
because it explicitly defines the data you are looking for. You can change the name to
something more reasonable. If you are satisfied with specifications you setup for the data
search, click Yes. (If not, click No and go back the appropriate step in the map to make a
change.)
Once you start the data search, Symphony will call the DataWarehouse
to search for your data. The results appear in a spreadsheet, which you can go ahead and
save, following the prompts on the screen.
Let’s add some more data to your spreadsheet. Make sure that
the spreadsheet you just created is open. (If it isn’t, go to your spreadsheet list
in the workspace, select the name of the spreadsheet and press Open.)
You have carbon monoxide data for a less dense area, now what kind
of data should you look for? Let’s now add some data for a more urban area (say
Livonia). Redo the steps from above, but this time add carbon monoxide data for Livonia.
Scroll through the spreadsheet to see the Livonia data. When
you’ve added the new row of data to your spreadsheet, save the spreadsheet again.
Now that you’ve finished searching for data, there is one more
area in the workspace to look at. Notice the What did you gain or learn in this
activity? text box. Here, you can sum up what you did in this workspace so that you
will have a record for this Step in your log. Write some notes describing what you did for
later reference. (Again, as your investigations get bigger, you’ll want to have a
good record of what exactly you did and why so you can show others the progress of your
investigation).
Save the work in your data collection workspace
(the Save my
work button in the workspace) to your log and save your Symphony session
(the Save
button under the plan/log grid). Now that you have collected some data, let’s
move on to the next step and start visualizing that data.
Visualizing Data
How will we go about visualizing data? We will
use Viz-It to build graphs of the data that you have in your spreadsheets.
As you have been doing previously, drag a
Visualize Data
activity from the main process map to your Plan row and open the workspace (figure 6).

Figure 6: Visualize Data Workspace
Click on the Build Graphs button and write some notes describing
what graphs you want to build and why.
Let’s build some graphs. You will use Viz-It to graph the data
in the spreadsheets you created earlier:
• Click on the Select Dataset button to select the data you
want to graph.
The window that opens has a menu that displays all of the different
spreadsheets that you have built along with an area where the selected spreadsheet is
displayed. Since you have only built one spreadsheet, the menu will only have one item.
Select the spreadsheet name in the spreadsheet menu.
Now, you need to select the data you want to graph. Do this by
clicking on the spreadsheet rows containing the data you want to visualize. Given the
driving question, we want to graph Kalamazoo and Livonia carbon monoxide data, so click on
both rows (for Kalamazoo and Livonia carbon monoxide). The rows that you select will turn
red. Click This is what I want to close the window.
• Click Select Graph Type. The window that opens contains
choices describing the different types of graphs that you can open. Selecting one of the
graph types shows you a description of what kinds of situations the graph is best for.
Here, select Bar Graph and press the This is what I want button.
• Click Select Graph Format. This is where you set up different
characteristics of the graph you will be building. Since we are building a bar graph, the
only decision you have to make is whether you want the bars to be vertical or horizontal.
Select Vertical.
• Click Confirm Choices. As before, here you review the choices
that you made. Also, click the small checkbox towards the bottom of the Confirm Choices
window. Click Everything is OK when you are satisfied with your choices.
The resulting graph will now appear in a window (when you see the
NetCharts splash screen, click on Press here to Continue to see the graph). The graph
might be "zoomed-in" all the way. Click on the graph using your
right
mouse button to zoom out. (You can zoom in the graph the same way you zoomed in on the
data collection Michigan map: by "drawing" a box using the left mouse button.)
Also, if you move the mouse pointer on top of one of the data bars in the bar graph, a
data value will popup showing the data value and date for the data point represented by
the bar. (This effected is "turned on" by checking the checkbox in the Confirm
Choices window. If no information pops up when you place the mouse pointer on a bar, you
might not have checked this checkbox.)
Go ahead and save the graph, following the prompts on the screen.
Type some notes describing what you accomplished and learned in the activity and
save
the workspace and the Symphony session.
Now that you have built a graph, let’s take a brief look at
building models.
Building Models
You will also be able to build system models
using TheoryBuilder. You can set up a modeling activity just as you have set up data
collection and graphing activities: drag a Model Data button from the process map
to the plan grid and pressing the button to open a Build Model workspace.
TheoryBuilder is essentially a Java version of Model-It, so we will
not go into detail about how to use TheoryBuilder. However, as a quick overview, we can
briefly describe what you will be doing with TheoryBuilder. You can build models to
describe how you think a system behaves. A system can be considered an environment where
you will add objects. Each object can have attributes or factors. You can then set up
relationships between the different attributes that describe how the different attributes
affect other attributes. You can then see how the model you built behaves given the
relationships that you have set up.
Let’s start wrapping up the Symphony tour.
Reviewing Progress
The last thing to
do is to revisit your driving question to see what you can say
about the work you’ve completed so far.
Drag a Review Progress
activity from the main process map to your Plan row. Open the Review
Progress workspace (figure 7).
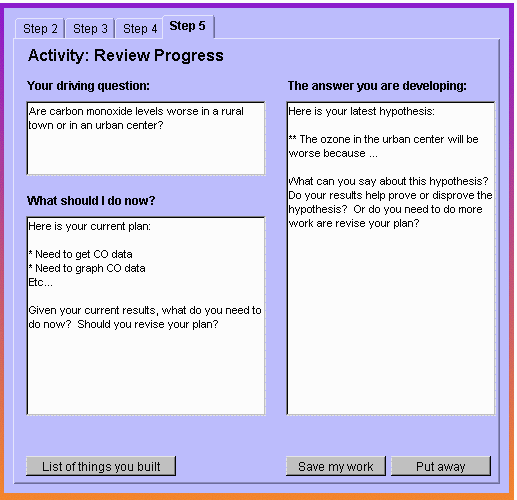
Figure 7: Review Progress Workspace
This workspace is where you can sum up the results you have
generated so far to try to answer your driving question and to plan out what you need to
do next. The different areas in the workspace show your driving question along with your
original hypothesis and plan. Here, you should look at the results you have generated to
try and support (or disprove) your original hypothesis.
You can look back at your results by pressing the List of things you
built button. This will bring up a the Artifacts Log window (figure 8) that has
buttons for every spreadsheet, graph, and model that you built. Pressing the buttons in
the log window will bring up the specified item. This way, you can quickly bring up your
different results as you try to answer the question in the workspace. Try it now by
opening some of the things you have built on this tour.
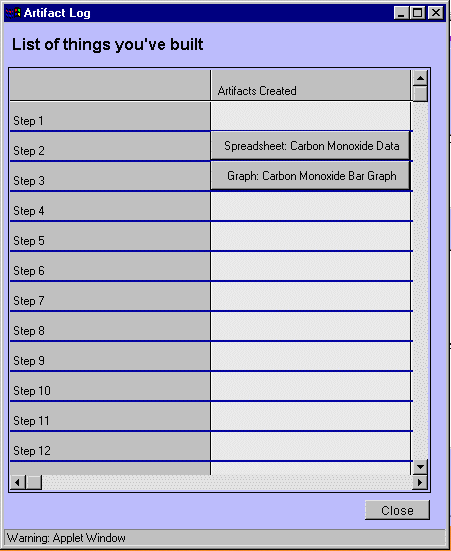
Figure 8: Artifact Log Window
Given your driving question and your hypothesis, try and write
down a preliminary answer in text area. Does the work you’ve done so far support your
hypothesis or does it dispute it? Do your have new questions as a result of what
you’ve done. Remember, if you need to review or refer to any of your previous notes,
you can always open the workspaces in your Log row.
As you try and write a preliminary answer, you might find that you
need to revise your plan (for example, if you do not have enough evidence to support your
hypothesis). Also, you might find that you need to change your hypothesis (for example, if
your evidence disproves your hypothesis) and fix your plan to investigate the new
hypothesis. Try and answer the different questions in the workspace and then
save the
workspace.
We are done for now. When you finish any Symphony session, put away
any activity workspaces that you may have open, saving them as needed. Finally,
save
your plan/log grid by pressing the Save button under the grid in the main screen. To
quit, simply press the Quit button under the plan/log grid and close your browser.
Next Steps: Continue Investigating
We have taken you through the different
activities that you can do with Symphony. At this point, let’s consider a couple of
points.
We ended our tour through Symphony at the
Review Progress
workspace. In this initial example, you might be able to provide some sort of answer for
the driving question we gave you. However, in a real science investigation, rarely will
you have a final answer so quickly. Most of the time, you will find that you need to do
more work: you might need more data, more graphs, etc. Also, when your review your work,
you might find that you are coming up with even more questions than answers.
This is the natural progression of a science investigation. You will
find that an investigation follows an iterative process; that is, you go back and
forth through the different activities over and over. And while our tour here took you
through the different activities in a pretty linear order, you will find that you
don’t always go through the different activities in a set order. Rather, you tend to
"bounce around" the different activities.
So now it’s your turn. You’ve seen what you can do with
Symphony, try exploring some questions of your own.
Symphony
Home Page | Tutorial
| Use Symphony Now!
Copyright ©
2000 Regents of the University
of Michigan
|